Introduction ELK Stack — to Get Logs
Requirements for this tutorial:
- node3 -> ubuntu 18.4 -> server
- node4 -> ubuntu 18.04 -> client
- node5 -> centos 7 -> client
Let’s Go:
Excecution on node3
- Install OpenJDK
1
2
| # sudo apt -y install openjdk-8-jdk
# java -version
|
- Install Elasticsearch
1
2
3
4
| # wget -qO - https://artifacts.elastic.co/GPG-KEY-elasticsearch | apt-key add -
# apt -y install apt-transport-https
# echo "deb https://artifacts.elastic.co/packages/7.x/apt stable main" | tee -a /etc/apt/sources.list.d/elastic-7.x.list
# apt -y update && apt -y install elasticsearch
|
- Configuration Elasticsearch
1
2
| # cp /etc/elasticsearch/elasticsearch.yml /etc/elasticsearch/elasticsearch.yml.original
# vi /etc/elasticsearch/elasticsearch.yml
|
edit line 55 to uncomment
1
| network.host: localhost
|
- Activate elasticsearch service
1
2
3
4
| systemctl daemon-reload
systemctl enable elasticsearch
systemctl start elasticsearch
systemctl status elasticsearch
|
- Test Elasticsearch
1
2
3
4
5
6
7
8
9
| root@node3:~# netstat -tulpn
Active Internet connections (only servers)
Proto Recv-Q Send-Q Local Address Foreign Address State PID
/Program name
tcp 0 0 0.0.0.0:80 0.0.0.0:* LISTEN 206
58/nginx: master
tcp 0 0 127.0.0.53:53 0.0.0.0:* LISTEN 843
3/systemd-resolv
tcp 0 0 0.0.0.0:22 0.0.0.0:* LISTEN 202
|
Curl elasticsearch
1
2
3
4
5
6
7
8
9
10
11
12
13
14
15
16
17
18
| root@node3:~# curl -XGET 'localhost:9200/?pretty'
{
"name" : "node3",
"cluster_name" : "elasticsearch",
"cluster_uuid" : "PPNElJoQT7mo8LP9hOkdBA",
"version" : {
"number" : "7.5.2",
"build_flavor" : "default",
"build_type" : "deb",
"build_hash" : "8bec50e1e0ad29dad5653712cf3bb580cd1afcdf",
"build_date" : "2020-01-15T12:11:52.313576Z",
"build_snapshot" : false,
"lucene_version" : "8.3.0",
"minimum_wire_compatibility_version" : "6.8.0",
"minimum_index_compatibility_version" : "6.0.0-beta1"
},
"tagline" : "You Know, for Search"
}
|
Kibana- Install Kibana
- Configuratation & integration kibana with elasticsearch
1
2
| cp /etc/kibana/kibana.yml /etc/kibana/kibana.yml.original
vi /etc/kibana/kibana.yml
|
edit line 7 to uncomment
1
| server.host: "localhost"
|
- Activate kibana service
1
2
3
| systemctl enable kibana
systemctl start kibana
systemctl status kibana
|
- Install & configuration nginx as a reverse proxy
1
| apt -y install nginx apache2-utils
|
1
2
| # cp /etc/nginx/sites-available/default /etc/nginx/sites-available/default.original
# vi /etc/nginx/sites-available/default
|
edit file /etc/nginx/sites-available/default, to be
1
2
3
4
5
6
7
8
9
10
11
12
13
14
15
16
17
| server {
listen 80;
server_name _;
auth_basic "Restricted Access";
auth_basic_user_file /etc/nginx/htpasswd.kibana;
location / {
proxy_pass http://localhost:5601;
proxy_http_version 1.1;
proxy_set_header Upgrade $http_upgrade;
proxy_set_header Connection 'upgrade';
proxy_set_header Host $host;
proxy_cache_bypass $http_upgrade;
}
}
|
- Create user & password to login dashboard kibana
1
| # htpasswd -c /etc/nginx/htpasswd.kibana [username]
|
1
2
3
4
| systemctl enable nginx
systemctl restart nginx
systemctl status nginx
netstat -tupln
|
- Access kibana dashboard
http://IP_node3
LOGSTASHExcecution on node3
1
| apt -y install logstash
|
- Configuration Logstash
1
| vi /etc/logstash/conf.d/input-filebeat.conf
|
- Create input to elasticsearch
1
2
3
4
5
| input {
beats {
port => 5044
}
}
|
- Create output to elasticsearch
1
| vi /etc/logstash/conf.d/output-elasticsearch.conf
|
1
2
3
4
5
6
7
| output {
elasticsearch {
hosts => ["localhost:9200"]
manage_template => false
index => "%{[fields][log_name]}_%{[agent][hostname]}_%{+YYYY.MM}"
}
}
|
- Activate logstash service
1
2
3
4
| systemctl enable logstash
systemctl start logstash
systemctl status logstash
netstat -tupln
|
FILEBEATExcecution on node4 & node5
- Install Filebeat on node4
1
2
3
4
5
6
7
8
9
| # apt -y update
# wget -qO - https://artifacts.elastic.co/GPG-KEY-elasticsearch | apt-key add -
# apt -y install apt-transport-https
# echo "deb https://artifacts.elastic.co/packages/7.x/apt stable main" | tee -a /etc/apt/sources.list.d/elastic-7.x.list
# apt -y update && apt -y install filebeat
# systemctl enable filebeat
# systemctl status filebeat
|
- Install Filebeat on node5
1
2
3
4
5
6
7
8
9
10
11
12
13
14
15
16
17
18
19
20
| # yum -y update
# rpm --import https://packages.elastic.co/GPG-KEY-elasticsearch
# vi /etc/yum.repos.d/elastic.repo
...
[elastic-7.x]
name=Elastic repository for 7.x packages
baseurl=https://artifacts.elastic.co/packages/7.x/yum
gpgcheck=1
gpgkey=https://artifacts.elastic.co/GPG-KEY-elasticsearch
enabled=1
autorefresh=1
type=rpm-md
...
# yum -y install filebeat
# systemctl enable filebeat
# systemctl start filebeat
# systemctl status filebeat
|
Send log to logstashExcecution on node3
1
2
3
4
5
6
7
8
9
10
| vi /etc/logstash/conf.d/filter-syslog.conf
...
filter {
if [fields][log_name] == "syslog" {
mutate {
add_tag => [ "syslog" ]
}
}
}
|
1
2
| systemctl restart logstash
systemctl status logstash
|
Execution on node4 & node5
1
| # mv /etc/filebeat/filebeat.yml /etc/filebeat/filebeat.yml.original
|
Config filebeat on node4
1
2
3
4
5
6
7
8
9
10
11
12
13
| # vi /etc/filebeat/filebeat.yml
...
filebeat.inputs:
- type: log
enabled: true
paths:
- /var/log/syslog
fields:
log_name: syslog
output.logstash:
hosts: ["IP_internal_node3:5044"]
...
|
Config filebeat on node5
1
2
3
4
5
6
7
8
9
10
11
12
13
| # vi /etc/filebeat/filebeat.yml
...
filebeat.inputs:
- type: log
enabled: true
paths:
- /var/log/messages
fields:
log_name: syslog
output.logstash:
hosts: ["IP_internal_VM_node3:5044"]
...
|
- Activate filebeat service
1
2
| # systemctl restart filebeat
# systemctl status filebeat
|
1
2
3
4
5
6
7
8
9
10
11
12
13
| root@node3:~# curl http://localhost:9200/_cat/indices?v
health status index uuid pri rep docs.co
unt docs.deleted store.size pri.store.size
green open .kibana_task_manager_1 M7mX7JkxRhqbRSFaZCZZ6w 1 0
2 1 43.5kb 43.5kb
green open .apm-agent-configuration _zg4Oj8OT-mPis3Xmaf5lw 1 0
0 0 283b 283b
yellow open syslog_node4_2020.01 zBnZ3VmORRyAVS37ozsC9A 1 1
187 0 194.1kb 194.1kb
green open .kibana_1 QOG6VQDFTzK0HXjeJQKRZQ 1 0
7 0 40.4kb 40.4kb
yellow open syslog_node5.novalocal_2020.01 QXjp-0GVTDSrOFKuFOY8Ig 1 1
856 0 376.1kb 376.1kb
|
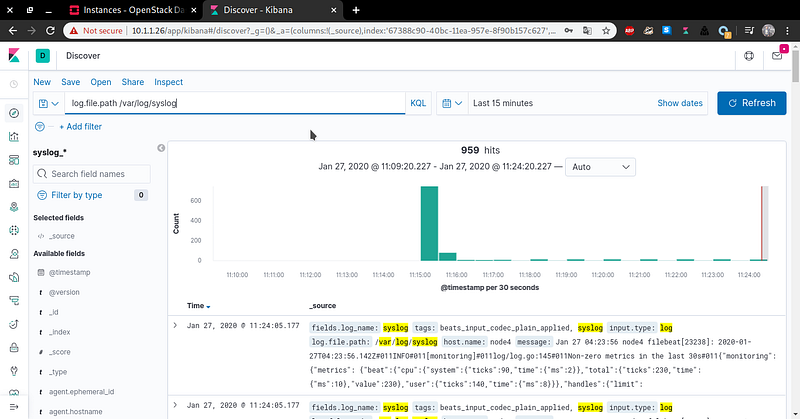
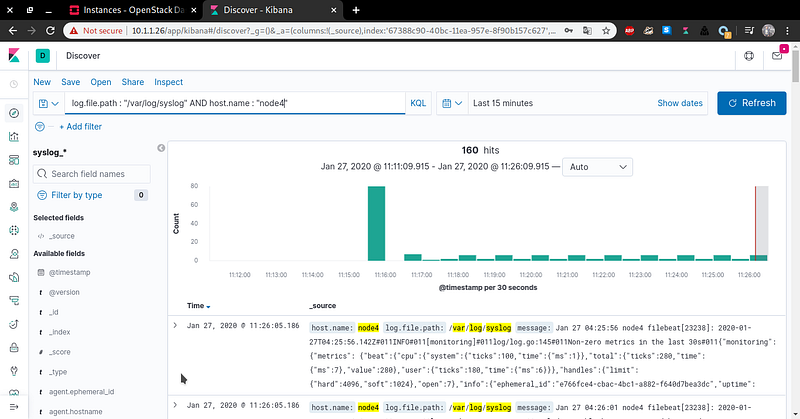
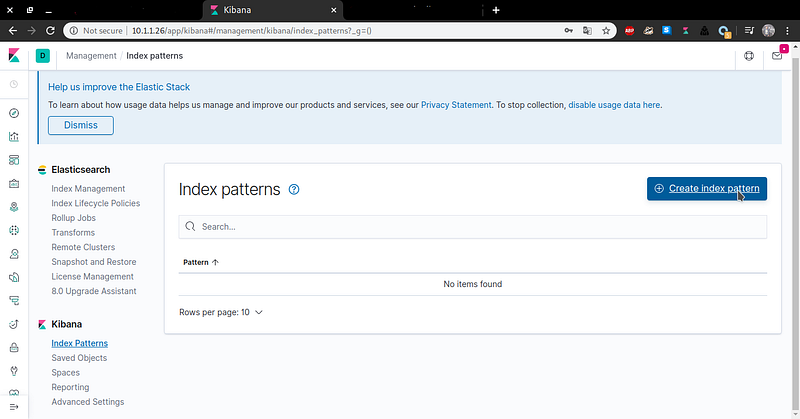
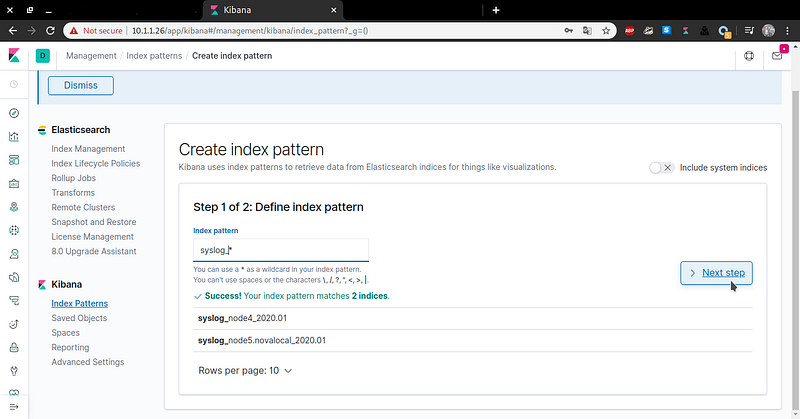
Dashboard Kibana
Search Log

 LOGSTASHExcecution on node3
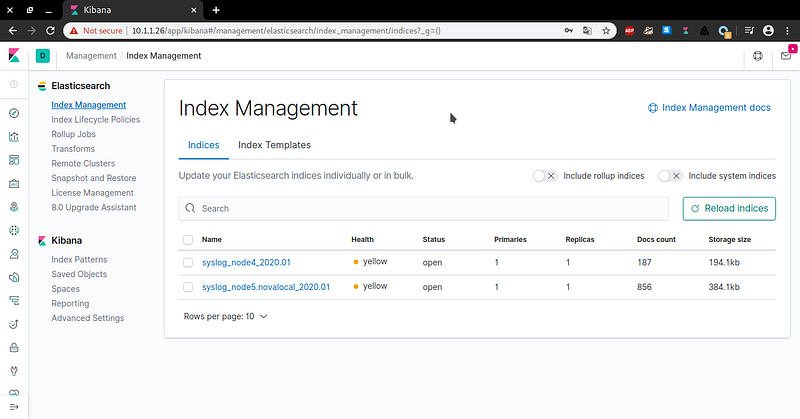


 Search Log